Learn about key considerations when reviewing user access. ...
8 Key Considerations When Reviewing User Access
Every day, companies collect massive amounts of data, including information regarding website traffic, customer inquiries, or sales data. With all this valuable data being collected, it is important for organizations to fully utilize it. One way to do this is by creating data visualizations, which are highly customizable, interactive visual portrayals of a dataset. These graphics can be used internally or externally, depending on the data and the goal of the visualization.
There are numerous reasons why it may be beneficial to create a visualization out of a dataset. First, because graphics can be created to summarize data based on any field, they allow users to visually see trends in their data. For example, it is possible to create reports showing the most common search terms from a website or highest selling products by month. Many people find data shown graphically to be much more meaningful than just seeing it numerically.
The two most popular data visualization software programs are Microsoft’s Power BI and Tableau, which was recently purchased by Salesforce. These applications are able to process massive amounts of raw data and produce custom visualizations. Developers select fields from the data to be used for each graphic and the format of the graphic. Format options include heat maps, highlight tables, tree maps, and more traditional charts like line graphs, pie charts, histograms, and bar charts. These programs are also capable of charting data by geographic fields like states, counties and specific locations.
Multiple visualizations can then be shown together as a dashboard, which allows users to see the relation and possible correlation between fields of data. These dashboards are a great way to summarize very large amounts of information. It is even possible to filter an entire dashboard to show only specific figures.
Another benefit of these programs is that they are able to connect directly to data sources like SQL servers, Google Analytics, Amazon Web Services, and other internet connected servers. This allows these visualizations to update with the servers. Therefore, once the visualization or dashboard is created, it is not necessary to go into the program and import the updated dataset.
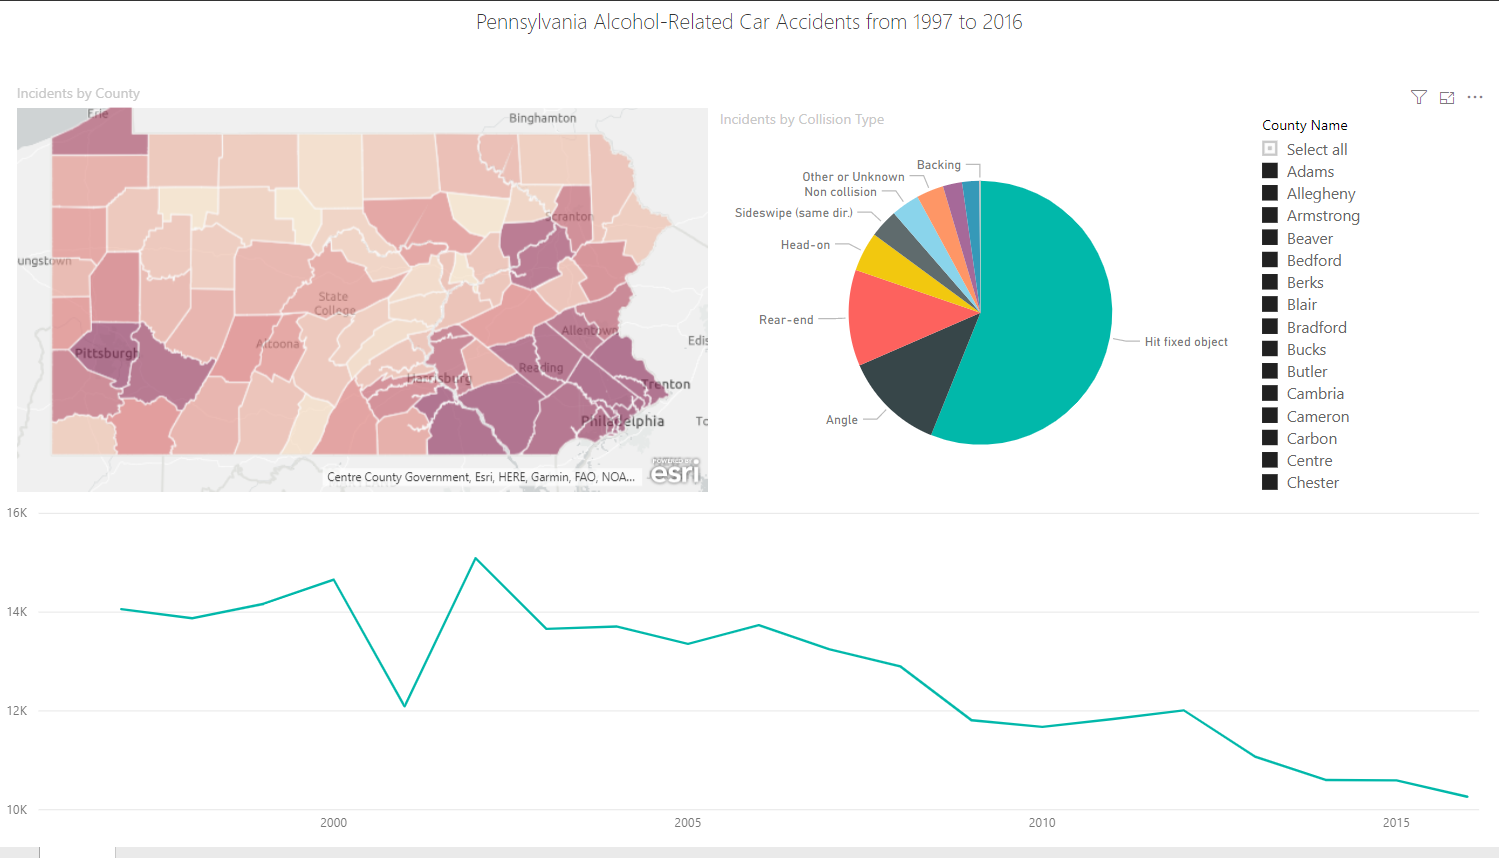
Just in time for the holiday season, which has a reputation for being a heavy drinking time of year, below is an example of a data visualization dashboard showing information regarding alcohol-related car accidents in Pennsylvania from 1997 to 2016. The data used in making the visualizations is publically available and provided by the Pennsylvania Department of Transportation. The first screenshot shows three visualizations in one dashboard. Starting at the top left, there is a heat map showing which counties have had the most alcohol-related accidents. Not surprisingly, the darkest areas on the map (indicating the most number of car accidents) are in heavily populated metropolitan areas. Next, there is a pie graph showing a break-out of the most common types of accidents that occur in alcohol-related incidents. Finally, the third visualization shows the number of alcohol-related accidents by year, which indicates a steady decline since the early 2000s.
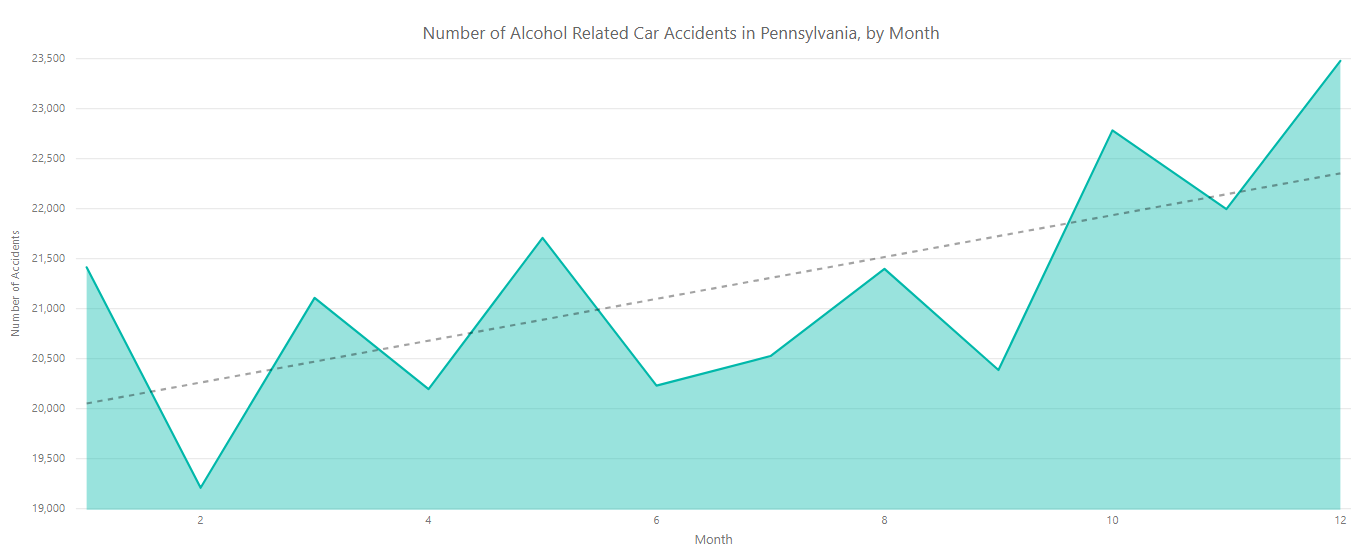
The screenshot below shows a visualization of when alcohol-related accidents have historically occurred throughout the year. Also shown on this visualization is a regression analysis. This is shown as a constant line showing that these accidents are more likely to occur later in the year. Displaying this information graphically allows users to see the trends clearly in the data that would otherwise be impossible to recognize without thorough analysis. This analysis confirms that the Holiday season is the most common time of year for alcohol-related car accidents. However, the good news is there has been a significant decline in the total number of these accidents in the past several years. So what is the cause? It is hard to pinpoint one direct cause for the significant decline, but some notable developments over the period under analysis include the growth of ride-sharing services (i.e., Uber or Lyft), strong drunken driving laws, and a rise in public awareness campaigns. So, please drive responsibly this holiday season to continue the trend of declining alcohol-related car accidents in Pennsylvania!
Data visualizations can transform your data into powerful graphics. If you think your business could benefit from data visualizations or want to know more, please contact a member of our data analytics team at Schneider Downs.
We’d love to hear from you. Drop us a note, and we’ll respond to you as quickly as possible.
Ask us
[email protected]
p:412.261.3644
f:412.261.4876
[email protected]
p:614.621.4060
f:614.621.4062
[email protected]
p:571.380.9003